Cloudwatch Real User Monitoring (RUM) end to end monitoring
I originally blogged about using canaries and RUM with the AWS-CDK here link.
In that blog post I was exploring how to create a website with an AWS Synthetics Canary.
This blog will revisit the Canary Stack I created, and enhance the experience of Real User Monitoring (RUM).
To get a deep dive on RUM checkout this blog post
What has Changed 
The cloudformation specification version v50.0.0 includes support for AWS::RUM API's. The AWS-CDK version v2.12.0 added Cloudformation RUM support 🎉.
This is great news, because previously the stack had some manual configuration that was not great for deterministic Infrastructure as Code (IaC) lovers I am sure.
TL; DR 
Source code, the ultimate TL; DR https://github.com/simonireilly/canary-stack/blob/main/lib/rum/rum-construct.ts
- I create a Rum construct, that uploads the
rum.jsscript to./rum.jsinside the s3 origin bucket for the website - I added default performance budgets for Largest Contentful Paint (LCP), First Input Delay (FID) and Cumulative Layout Shift (CLS).
The stack ends up looking something like this:
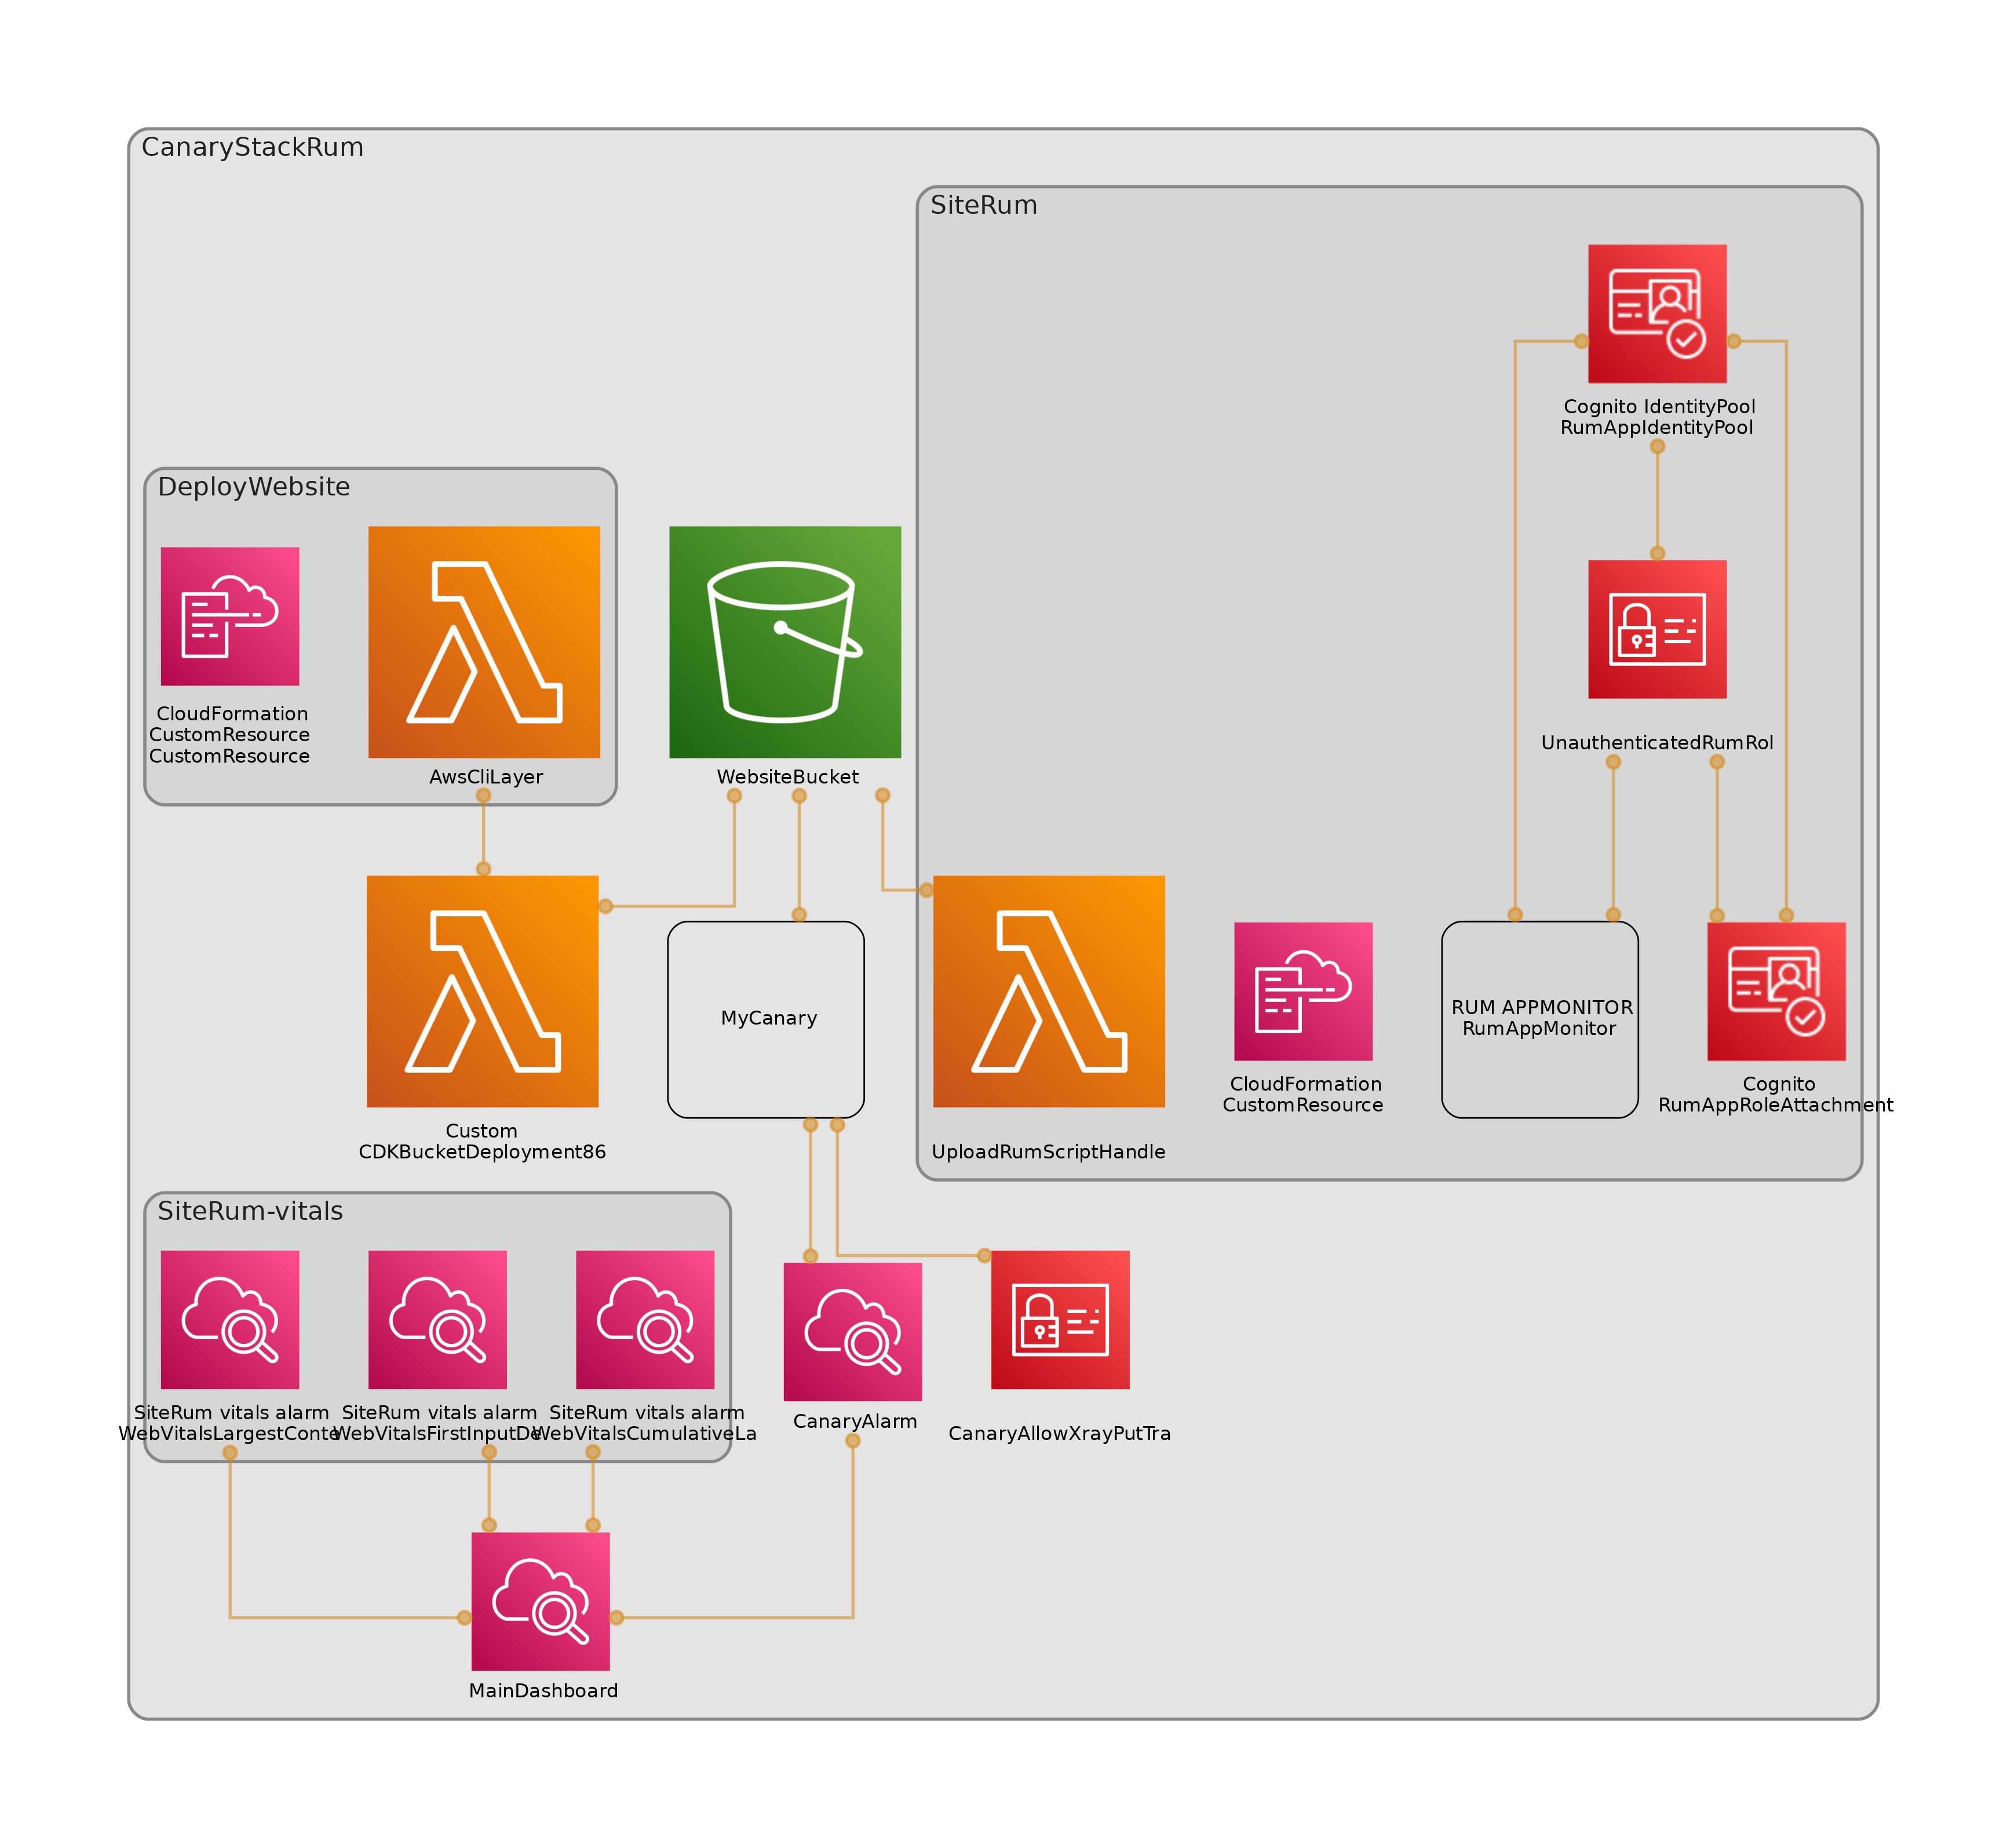
Image by cdk-dia
Design 
I really like some products, like speedcurve that enable setting performance budgets for the website, so I think I would like something like this (pseudo code):
new Rum(this, 'MyRumResource', {
  topLevelDomain: "*.s3-website-eu-west-1.amazonaws.com"
  appMonitorName: 'simons-website-monitor',
  s3Bucket: websiteBucket,
  // In milliseconds see: https://web.dev/vitals/
  performanceBudgets: {
    CLS: 100,
    LCP: 2500,
    FID: 100
  }
})
The underlying behavior should be that I get alerts when the website performs below these thresholds.
So I need to build this Rum construct to do this for me, ok, here we go.
Updating the stack 
I am going to add a custom Rum construct to my stack, that is going to hide the Cfn implementation of RUM.
I am also going to enable AWS XRay, and connect my Canary to my RUM monitor using tags.
First things first, I need the newest version of AWS-CDK installed:
yarn upgrade-interactive --latestUpgrading the AWS-CDK worked fine for me using yarn interactive. Before I made any changes I did a re-deploy to ensure I wasn't starting from a bad basis, now we can continue.
Creating the App Monitor 
With the latest version of the AWS-CDK we can now use the CfnAppMonitor construct to deploy an app monitor.
The App Monitor needs an associated authentication mechanism. I have chosen to use a Cognito Identity Pool, that will get temporary AWS access keys as an unauthenticated user.
That just looks like this:
this.identityPool = new CfnIdentityPool(this, "RumAppIdentityPool", {
  allowUnauthenticatedIdentities: true,
});
So next, I need to allow the Cognito Identity service to assume a role that allows it to put rum events and xray trace segments. This next one is a little more verbose, but here it is:
new Role(this, "UnauthenticatedRumRole", {
  assumedBy: new FederatedPrincipal(
    "cognito-identity.amazonaws.com",
    {
      StringEquals: {
        "cognito-identity.amazonaws.com:aud": this.identityPool.ref,
      },
      "ForAnyValue:StringLike": {
        "cognito-identity.amazonaws.com:amr": "unauthenticated",
      },
    },
    "sts:AssumeRoleWithWebIdentity"
  ),
  inlinePolicies: {
    RUMPutBatchMetrics: new PolicyDocument({
      statements: [
        new PolicyStatement({
          actions: ["rum:PutRumEvents"],
          resources: [
            // We can construct any Arn this way
            Stack.of(this).formatArn({
              service: "rum",
              resource: "appmonitor",
              // This will come in later, but for
              // now its a string 👍
              resourceName: this.appMonitorName,
            }),
          ],
        }),
        // Xray needs access to all resources on
        // PutTraceSegments, you can check
        // the docs here:
        // https://docs.aws.amazon.com/xray/latest/devguide/security_iam_service-with-iam.html#security_iam_service-with-iam-resource-based-policies
        new PolicyStatement({
          actions: ["xray:PutTraceSegments"],
          resources: ["*"],
        }),
      ],
    }),
  },
});
Now with this minimum privileged role, and the identify pool it references, we will perform an attachment. This will mean that the identity pool will have this attached role.
new CfnIdentityPoolRoleAttachment(this, "RumAppRoleAttachment", {
  identityPoolId: this.identityPool.ref,
  roles: {
    unauthenticated: this.unauthenticatedRumRole.roleArn,
  },
});
From here on out it is plain sailing. we can pick the configuration that we want for the CfnAppMonitor. I have decided to go all in with all the telemetries, xray and cookies enabled.
new CfnAppMonitor(this, "RumAppMonitor", {
  name: this.appMonitorName,
  cwLogEnabled: true,
  domain: this.topLevelDomain,
  appMonitorConfiguration: {
    allowCookies: true,
    enableXRay: true,
    sessionSampleRate: 1,
    telemetries: ["errors", "performance", "http"],
    identityPoolId: this.identityPool.ref,
    guestRoleArn: this.unauthenticatedRumRole.roleArn,
  },
});
We can deploy all this into our stack and we will have a great pile of infrastructure, but unfortunately, there won't be any RUM.
That's because cloudwatch console will tell us we need to add a script to our website, so I am going to solve automating the injection of that script.
Automating the RUM script 
I am going to assume that I can modify the s3 bucket, to inject a ./rum.js script. Currently the bucket contents are as such:
.
├── images
│   ├── diagram.avif
│   ├── diagram.png
│   └── diagram.webp
└── index.html
I will write an AWS-CDK custom resource that injects a script into the bucket, and then the bucket will look like:
.
├── rum.js
├── images
│   ├── diagram.avif
│   ├── diagram.png
│   └── diagram.webp
└── index.html
So in my website I will add to the <head> tag the following:
<script src="rum.js"></script>And once that file is in the bucket, the browser will pull it down after it parses the HTML 👍.
Template for rum.js 
The RUM script provided by AWS is only available in the dashboard. But on inspection, its fairly simple. So, I've gone and made it a template, here we go:
const RUM_TEMPLATE = (rum: RUM.AppMonitor): string => `
(function (n, i, v, r, s, c, x, z) {
  x = window.AwsRumClient = { q: [], n: n, i: i, v: v, r: r, c: c };
  window[n] = function (c, p) {
    x.q.push({ c: c, p: p });
  };
  z = document.createElement('script');
  z.async = true;
  z.src = s;
  document.head.insertBefore(
    z,
    document.head.getElementsByTagName('script')[0]
  );
})(
  'cwr',
  '${rum.Id}',
  '1.0.0',
  'eu-west-1',
  'https://client.rum.us-east-1.amazonaws.com/1.2.1/cwr.js',
  {
    sessionSampleRate: ${rum.AppMonitorConfiguration?.SessionSampleRate},
    guestRoleArn:
      '${rum.AppMonitorConfiguration?.GuestRoleArn}',
    identityPoolId: '${rum.AppMonitorConfiguration?.IdentityPoolId}',
    endpoint: 'https://dataplane.rum.eu-west-1.amazonaws.com',
    telemetries: [${
      '"' + rum.AppMonitorConfiguration?.Telemetries?.join('","') + '"'
    }],
    allowCookies: ${rum.AppMonitorConfiguration?.AllowCookies},
    enableXRay: ${rum.AppMonitorConfiguration?.EnableXRay},
  }
);
`;
So we have an Immediately Invoked Function Expression (IIFE) here, which, once on our page will:
- Run with the arguments we place in the final set of brackets.
- Pull from a remote the
https://client.rum.us-east-1.amazonaws.com/1.2.1/cwr.js- A good candidate to add to your Content Security Policy (If you have one 😱).
- Insert the
cwr.jsscript as the first element in the page.
Syncing rum.js to s3 
I want to run the template when I know the full App Monitor configuration. However, this is only know after the app monitor has been provisioned.
This can be solved using an AWS-CDK custom resource.
The custom resource will:
- Deploy a lambda function which provides its ARN as the serviceToken
- Take the App Monitor name as a property
- Ensure that once the App Monitor is deployed it invokes the lambda service
That lambda will make a call to get the current configuration of the RUM App Monitor:
const appMonitor = await rum
  .getAppMonitor({
    Name: appMonitorName,
  })
  .promise();
And it will inject that configuration into the above template. That's all looking good so shall we take a look at the end results?
  /**
   * Places a script inside the aws s3 bucket that serves the website
   * using a custom resource
   */
  private uploadRumFile() {
    const fn = new NodejsFunction(this, "UploadRumScriptHandler", {
      handler: "handler",
      entry: path.join(__dirname, "custom", "handler", "index.ts"),
    });

    fn.addToRolePolicy(
      new PolicyStatement({
        actions: ["s3:PutObject*", "s3:DeleteObject*"],
        resources: [`${this.s3Bucket.bucketArn}/rum.js`],
      })
    );

    fn.addToRolePolicy(
      new PolicyStatement({
        actions: ["rum:GetAppMonitor"],
        resources: [
          Stack.of(this).formatArn({
            service: "rum",
            resource: "appmonitor",
            resourceName: this.appMonitorName,
          }),
        ],
      })
    );

    new CustomResource(this, "UploadRumScriptToWebsiteBucket", {
      serviceToken: fn.functionArn,
      properties: {
        s3BucketName: this.s3Bucket.bucketName,
        appMonitorName: this.appMonitorName,
        appMonitorConfiguration: this.appMonitor,
        // The CDK needs to always upload the rum, otherwise the new web
        // deployment erases the file.
        trigger: Date.now(),
      },
    });
  }
Results 
There are a number of things for us to checkout, first, lets take a look at Real User Monitoring:
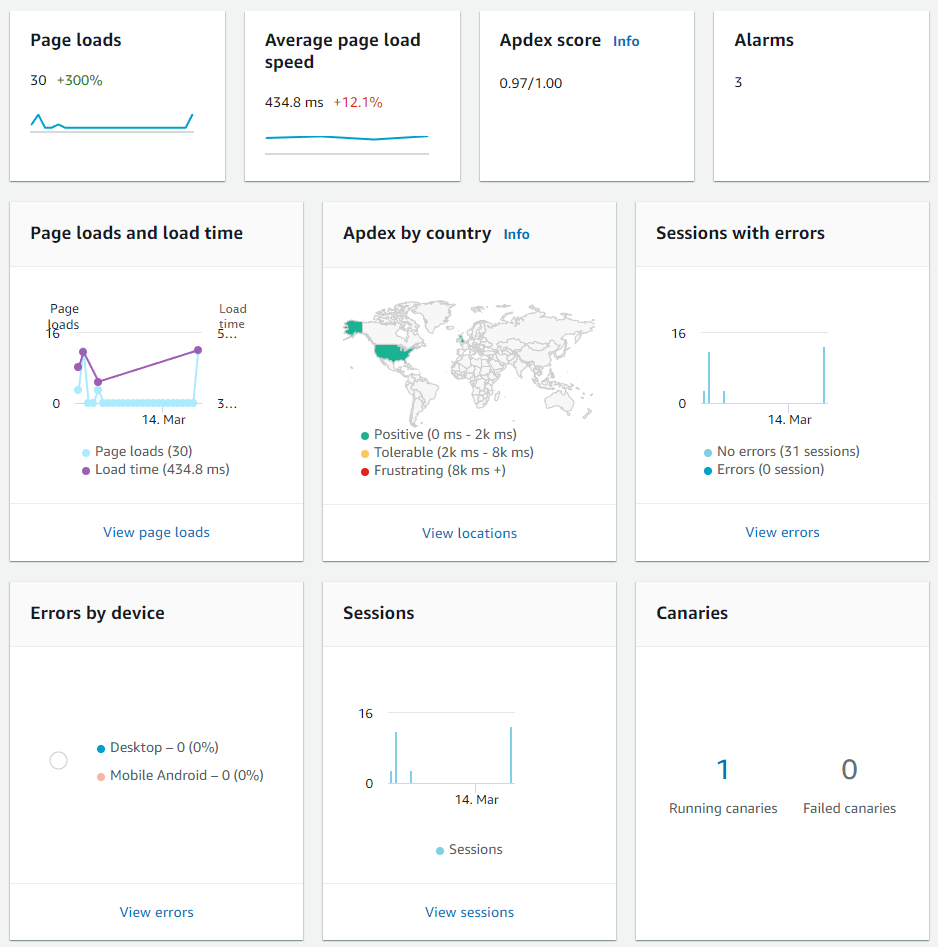
Key takeaways 
We have got Real User Monitoring 👍
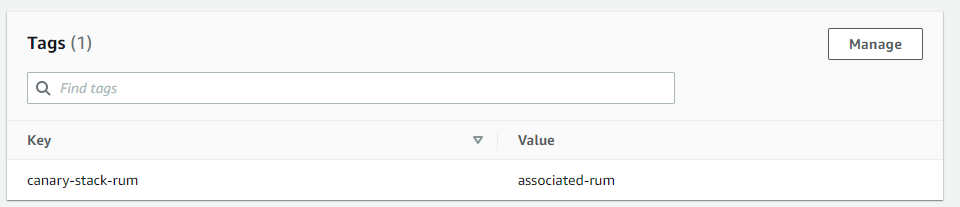
We can see in the bottom right that there is an associated Canary, that works like this:
Tags.of(canary).add(rum.appMonitor.name, "associated-rum");Or, configure manually as a tag on your canary like so:
Extra Credit: Adding Web Vital Performance Budgets 
It's all well can good to have detailed metrics about your users, but we don't want to sit around and check them all day for regressions.
Instead I am going to add some error budgets that can be used for the site.
Cloudwatch has got some great metrics built into it for this stuff which is being gathered by the App Monitor. I have decided to make a new construct around those which enables creating them inside any stack that has an app monitor like such:
const vitals = new WebVitals(this, "WebVitals", {
  appMonitorName: "canary-stack-monitor",
  /**
   * Cumulative Layout Shift (CLS): measures visual stability. To provide a good
   * user experience, pages should maintain a CLS of 0.1. or less.
   */
  WebVitalsCumulativeLayoutShift: 0.1,
  /**
   * First Input Delay (FID): measures interactivity. To provide a good user
   * experience, pages should have a FID of 100 milliseconds or less.
   */
  WebVitalsFirstInputDelay: 100,
  /**
   * Largest Contentful Paint (LCP): measures loading performance. To provide a
   * good user experience, LCP should occur within 2.5 seconds of when the page
   * first starts loading.
   */
  WebVitalsLargestContentfulPaint: 2500,
});
This construct create the metrics and some alarms that can be added to a dashboard.
Here is the private method that sets the performance budget for each named WebVital metric:
  /**
   * Web Vitals are configured to have alarms and metrics for the average real
   * user experience by default.
   */
  private configureVital(
    name: keyof WebVitalsPerformanceVitals,
    performanceBudget: number,
    statistic: "min" | "max" | "avg" | "p50" | "p90" | "p95" | "p99" = "avg"
  ): ICloudwatchWebVitalProps {
    const metric = new Metric({
      metricName: name,
      namespace: "AWS/RUM",
      dimensionsMap: {
        application_name: this.appMonitorName,
      },
      statistic,
    });

    const alarm = new Alarm(this, `${this.id}-alarm-${name}`, {
      evaluationPeriods: 2,
      threshold: performanceBudget,
      alarmName: name,
      metric,
    });

    return { metric, alarm };
  }
I have included them in a dashboard that also shows the status of the canary:
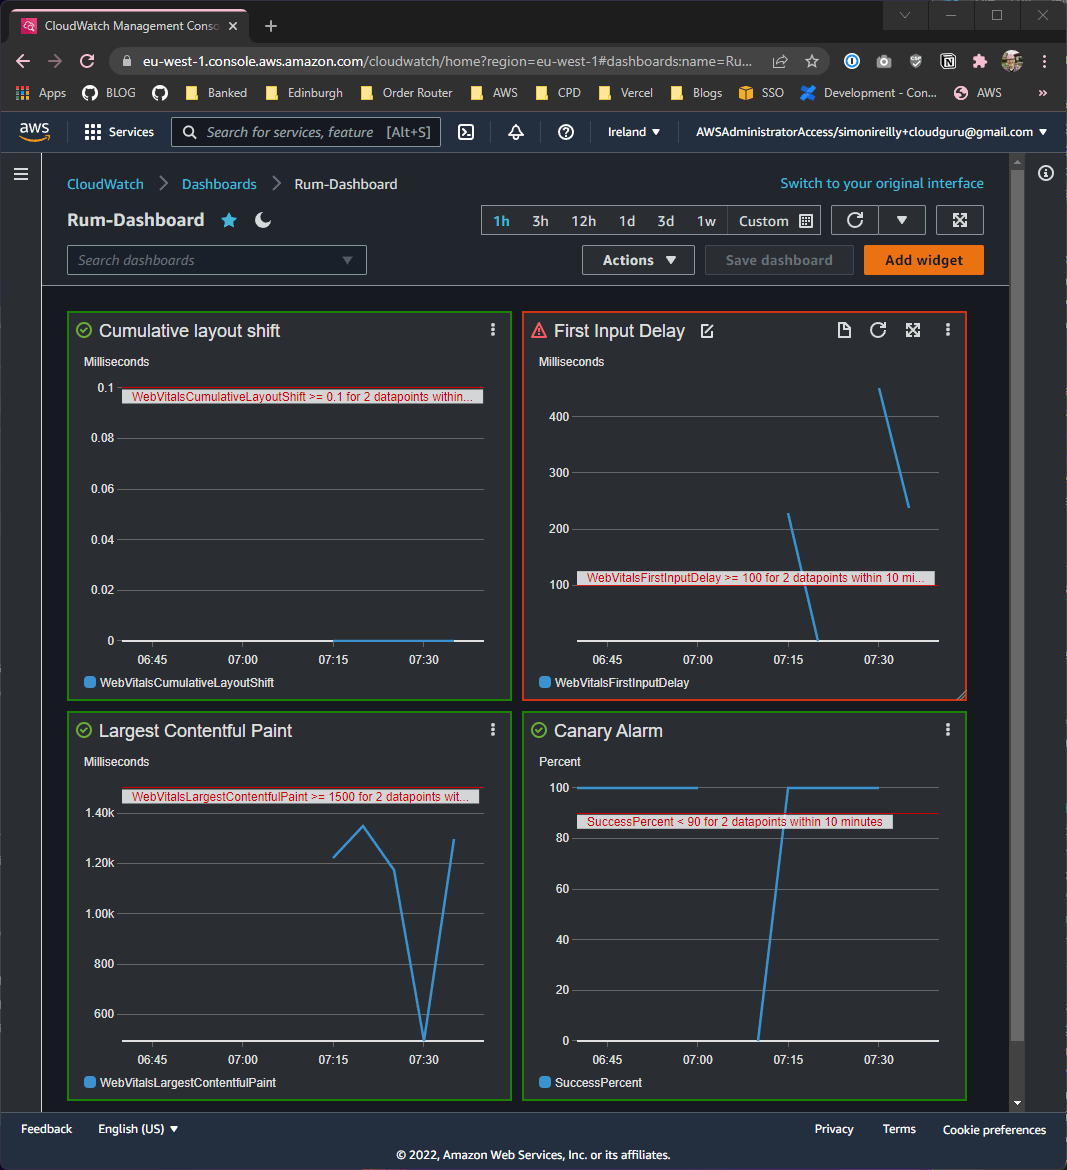
😱 Looks like I have some issues with First Input Delay! I will need to fix those another time 🤣
Wrap Up 
In this blog I showed:
- How to configure AWS Real User Monitoring (RUM) App Monitor for your website
- I showed how a custom resource can be written to upload the rum script
- I showed how to access the metrics created by RUM
- I showed how to associate canaries to the RUM agent
- I showed how to set performance budgets for the Web Vitals that the RUM agent gathers
That's a whole lot, and most of the detail is available in the source code, so i would encourage you to take a closer look if you are thinking about using AWS RUM