Fullstack observability with AWS CDK V2 Canary's and Synthetics
Version 2 of the AWS Cloud Development Kit (CDK) shipped a couple weeks ago.
As part of that release AWS have separated stable and experimental cdk libraries. In this blog I am going to build out with some of te new tools and features to learn a little about how to use experimental constructs, and also to share some observability tooling setups for monitoring your websites.
In this blog 
- Build a website with AWS CDK
- Create a canary to continuously monitor the websites up time
- Create a cloudwatch dashboard as a single source of truth for observability
- Add Real User Monitoring to the website to get detailed user journeys and page load analytics
TL; DR 
The canary stack can be found here: https://github.com/simonireilly/canary-stack
Once deployed you will have a Dashboard and Alarm for an S3 bucket website.
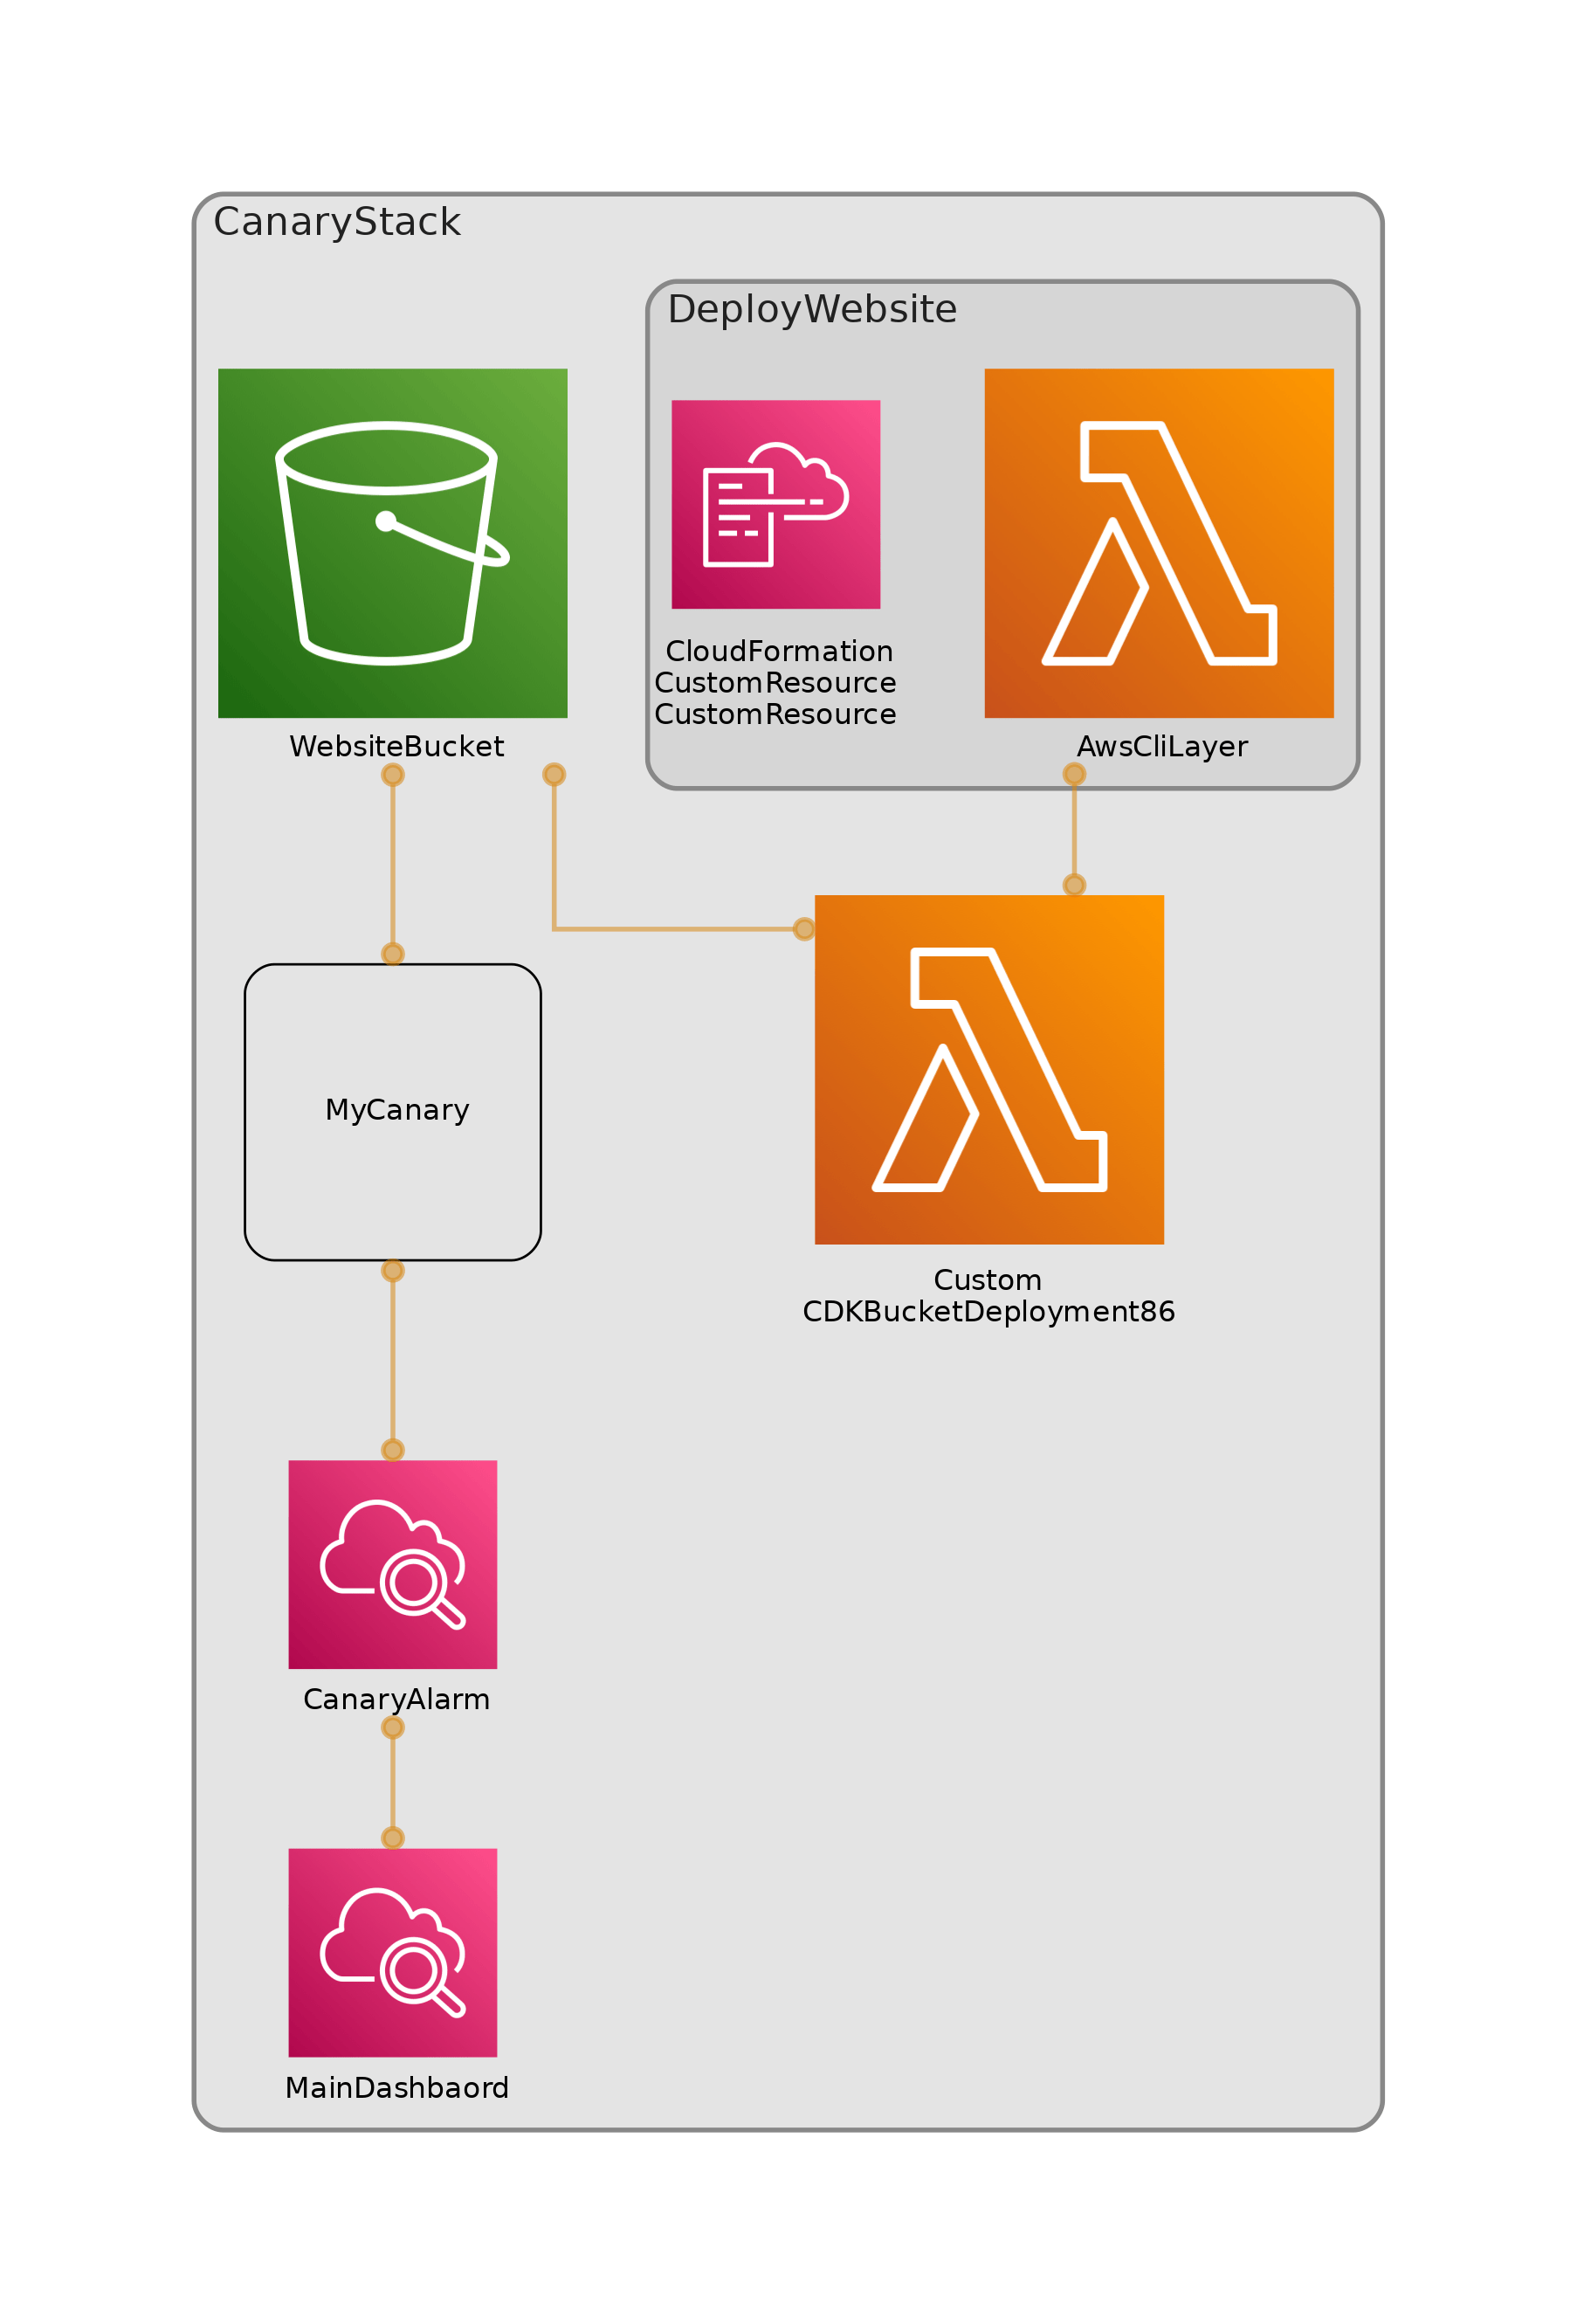
The architecture that is built once complete is:
Starting a cdk v2 project 
Lets begin.
I do the following to get the project configured:
mkdir canary

cd canary

npx [email protected] init app --language typescript
This creates the basic structure.
Previous modules would ship separately, this is still the case for experimental modules.
Adding Experimental modules 
To add an experimental module you need to install it with yarn or npm.
yarn add @aws-cdk/aws-synthetics-alphaYou know, I could not recommend cdk-dia enough, with will give you a nice diagram of your stack:
yarn add --dev cdk-diaBuilding a Website with canaries 
Get started by adding a website to your stack:
mkdir -p lib/website

touch lib/website/index.html
In there you need some HTML, this will do:
<!DOCTYPE html>
<html>
  <head>
    <meta charset="utf-8" />
    <title>Your website</title>
    <meta name="viewport" content="width=device-width, initial-scale=1" />
  </head>
  <body>
    <main style="display: flex; flex-direction: column; align-items: center;">
      <h1>Welcome to the canary stack</h1>

      <p>This is a simple single page website that show cases the aws-cdk.</p>
    </main>
  </body>
</html>
Now you can deploy your website from the stack using 2 AWS buckets, one to hold the zipped files, and another to deploy as a public website.
import { Bucket } from "aws-cdk-lib/aws-s3";
import { BucketDeployment, Source } from "aws-cdk-lib/aws-s3-deployment";
import { Construct } from "constructs";
import { Stack, StackProps, CfnOutput } from "aws-cdk-lib";
import * as path from "path";

export class CanaryStack extends Stack {
  constructor(scope: Construct, id: string, props?: StackProps) {
    super(scope, id, props);

    const websiteBucket = new Bucket(this, "WebsiteBucket", {
      websiteIndexDocument: "index.html",
      publicReadAccess: true,
    });

    new BucketDeployment(this, "DeployWebsite", {
      sources: [Source.asset(path.join(__dirname, "website"))],
      destinationBucket: websiteBucket,
    });

    new CfnOutput(this, "WebsiteUrl", {
      value: websiteBucket.bucketWebsiteUrl,
    });
  }
}
The output from this will reveal your website URL:
 ✅  CanaryStack

Outputs:
CanaryStack.WebsiteUrl = http://canarystack-websitebucket75c24d94-z8brk94c8nvu.s3-website-eu-west-1.amazonaws.com
Adding a Canary 
We want to be able to monitor our websites up time, to do that we can add a canary.
The canary code looks like this:
const canary = new Canary(this, "MyCanary", {
  schedule: Schedule.rate(Duration.minutes(5)),
  test: Test.custom({
    code: Code.fromAsset(path.join(__dirname, "canary")),
    handler: "index.handler",
  }),
  runtime: Runtime.SYNTHETICS_NODEJS_PUPPETEER_3_3,
  environmentVariables: {
    SITE_URL: websiteBucket.bucketWebsiteUrl,
  },
});
You need to be specific about where you put the canary javascript. From what I can tell it follows the same patter as when building AWS layers.
mkdir -p lib/canary/nodejs/node_modules

touch lib/canary/nodejs/node_modules/index.js
Now you want to put the canary javascript into that file like so:
const synthetics = require("Synthetics");
const log = require("SyntheticsLogger");
const pageLoadBlueprint = async function () {
// Configure the stage of the API using environment variables
const url = String(process.env.SITE_URL);
const page = await synthetics.getPage();
const response = await page.goto(url, {
waitUntil: "domcontentloaded",
timeout: 30000,
});
// Wait for page to render. Increase or decrease wait time based on endpoint being monitored.
await page.waitFor(15000);
// This will take a screenshot that will be included in test output artifacts.
await synthetics.takeScreenshot("loaded", "loaded");
const pageTitle = await page.title();
log.info("Page title: " + pageTitle);
if (response.status() !== 200) {
throw "Failed to load page!";
}
};
exports.handler = async () => {
return await pageLoadBlueprint();
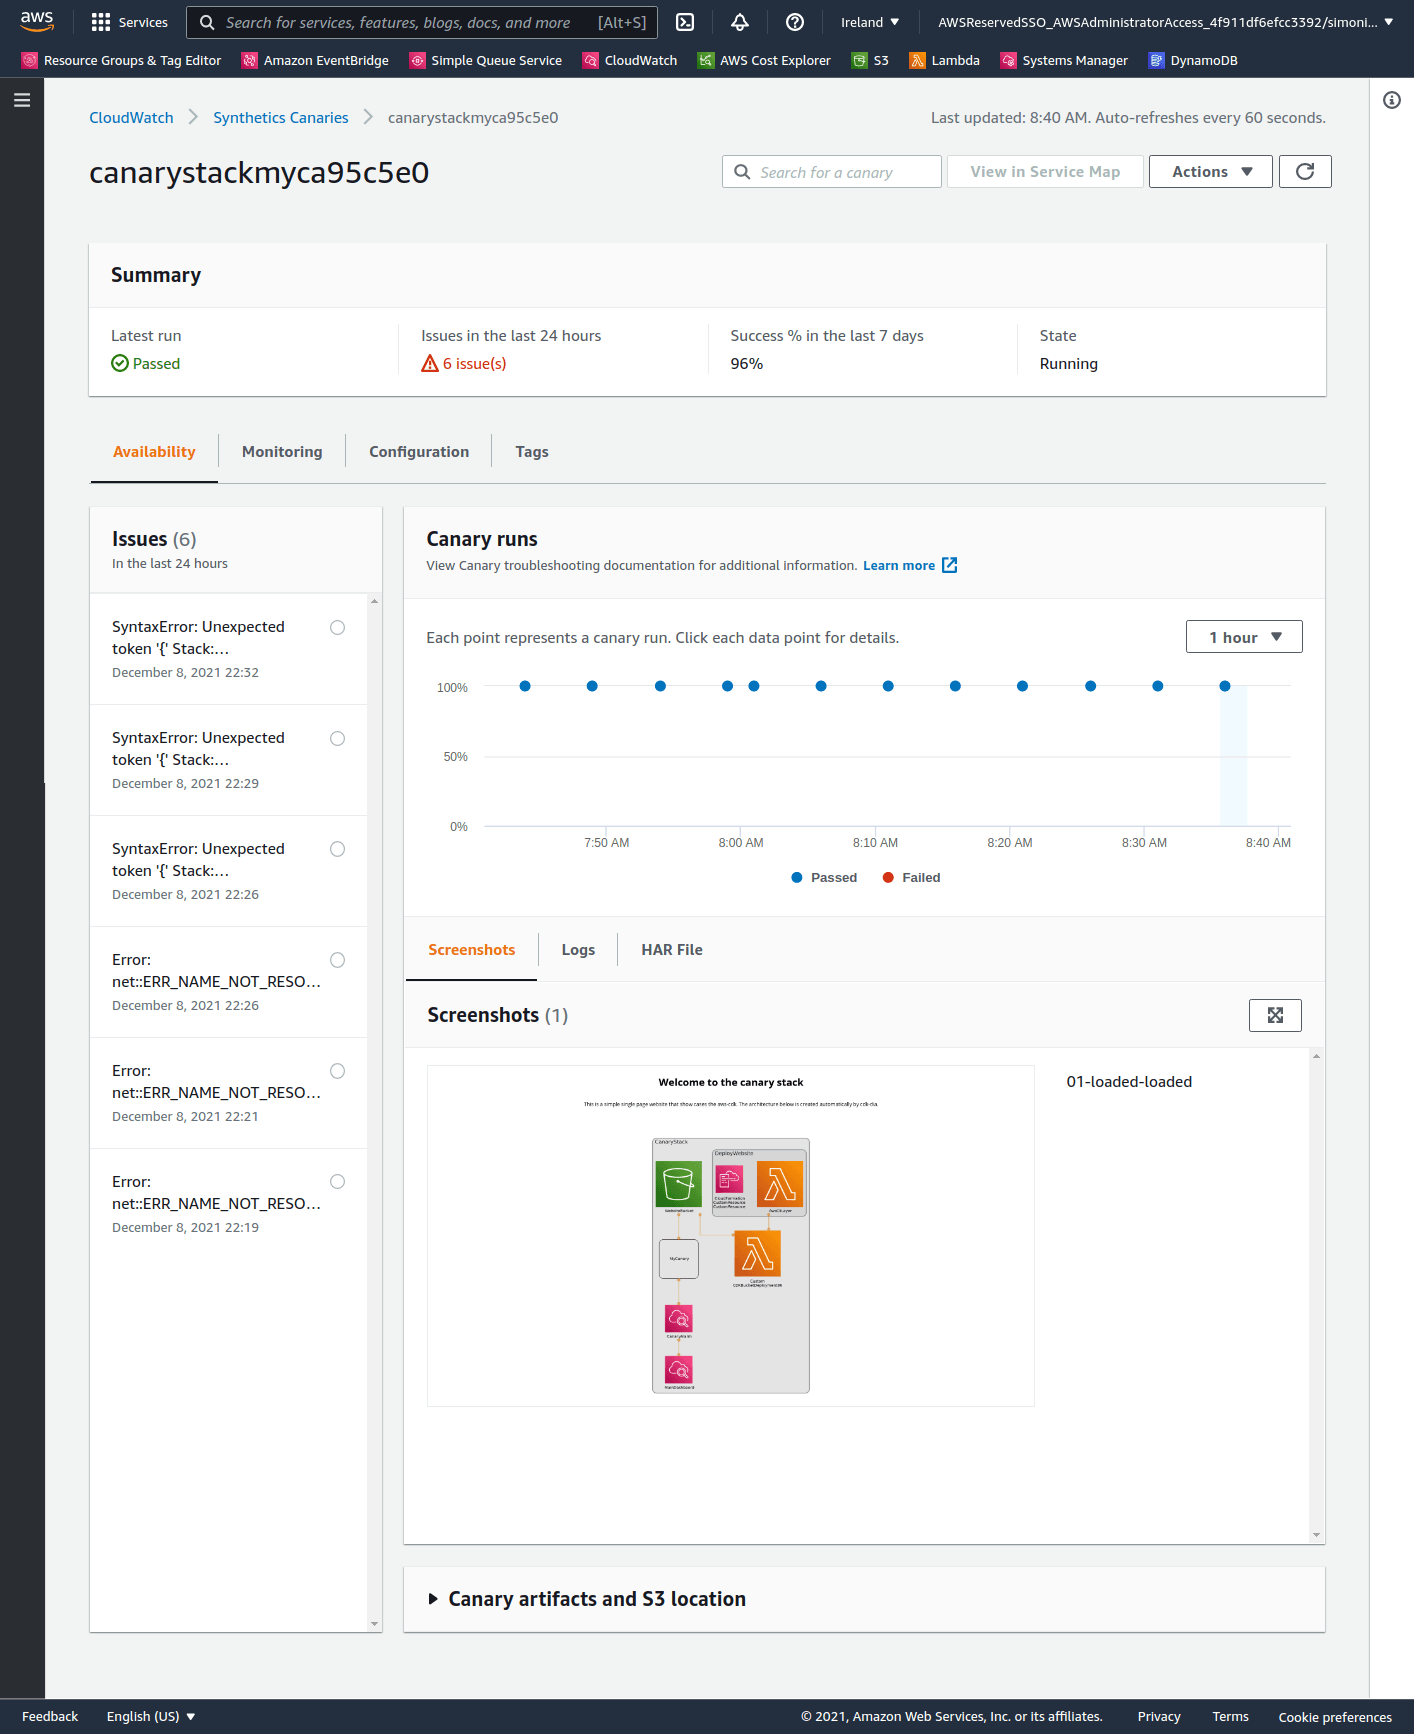
};Now we can deploy again:
yarn cdk deployThis time we will have a canary to go and see in the dashboard which looks like this:
Adding Alerts 
Monitoring is hard, but it doesn't need to be hard to implement.
The CDK can make creating a dashboard and an alarm for the canary very easy.
Here is the code you need:
const alarm = new Alarm(this, "CanaryAlarm", {
metric: canary.metricSuccessPercent(),
evaluationPeriods: 2,
threshold: 90,
comparisonOperator: ComparisonOperator.LESS_THAN_THRESHOLD,
});
const alarmWidget = new AlarmWidget({
alarm,
title: "Canary Alarm",
});
const dashboard = new Dashboard(this, "MainDashbaord", {
dashboardName: "Main-Dashboard",
periodOverride: PeriodOverride.AUTO,
widgets: [[alarmWidget]],
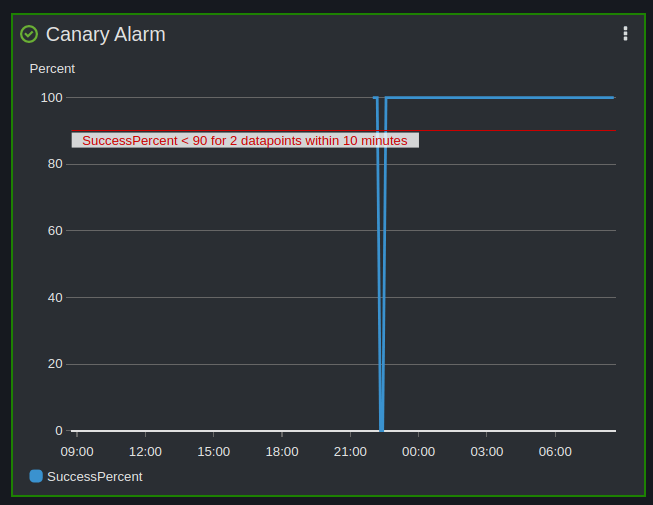
});Thats all it takes to get setup with a dashboard for your site.
Adding Real User Monitoring 
AWS just launched Real User Monitoring (RUM). This is a client side tool that tracks the real user journey and page load analytics.
You can read about RUM in Jeff Barr's announcement blog post: https://aws.amazon.com/blogs/aws/cloudwatch-rum/
You should follow the wizard to set this up and chose the option to get a new cognito user pool.
Then you can copy the snippet produced into the <head> tag within the lib/website/index.html.
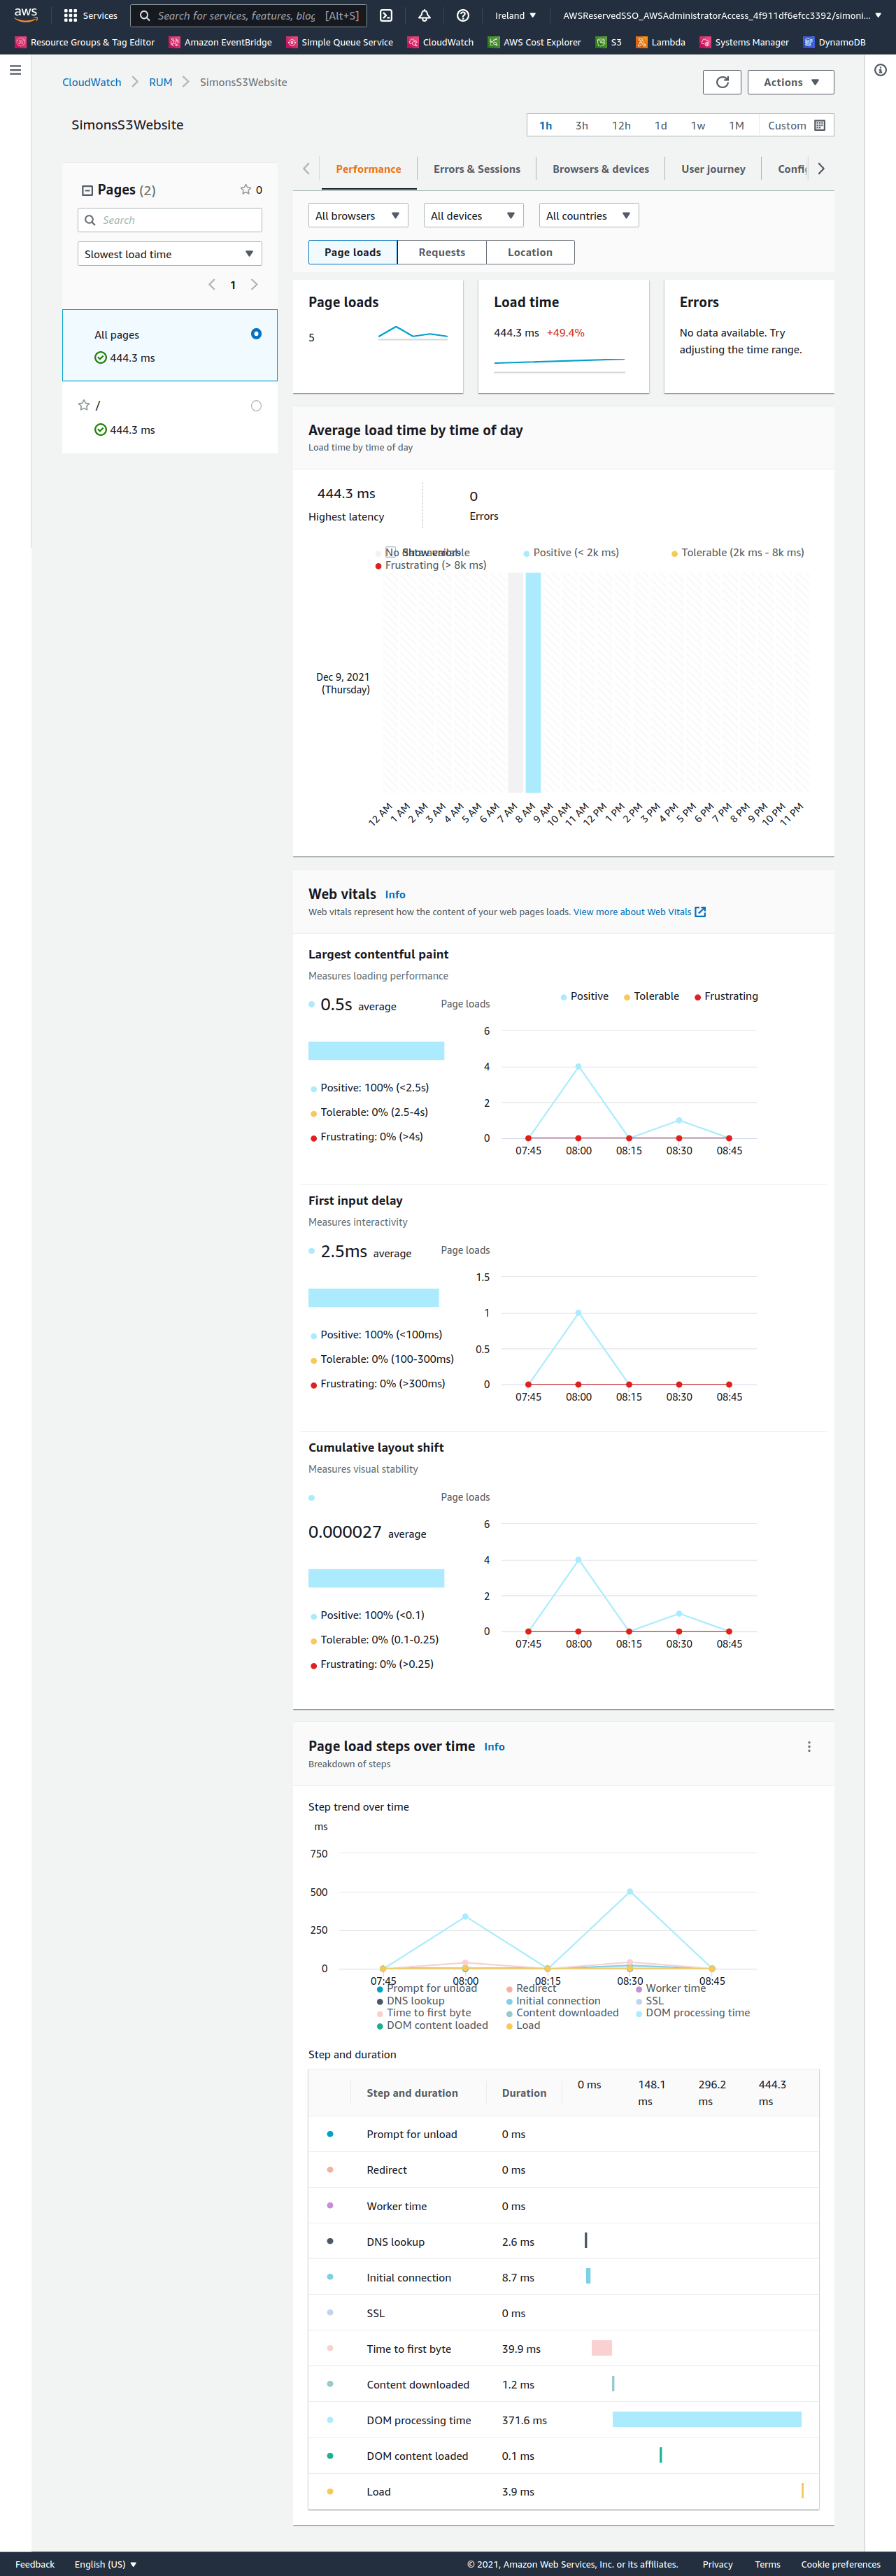
Now we deploy again:
yarn deployWhen we go to the rum dashboard we will see all the stats for a users session:
Closing 
With a canary in place you have:
- A simple health check for your web application.
- You can now layer more features onto the canary, such as:
- User login using aws-sdk and cognito
- Visual regression testing
- In the future